The MCPTotal dashboards
MCPTotal includes dashboards that provides users and admins with a summary view of activity.
The user dashboard
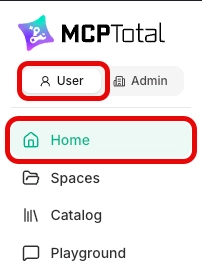
You access the user dashboard by selecting the User toggle in the main menu and clicking Home.
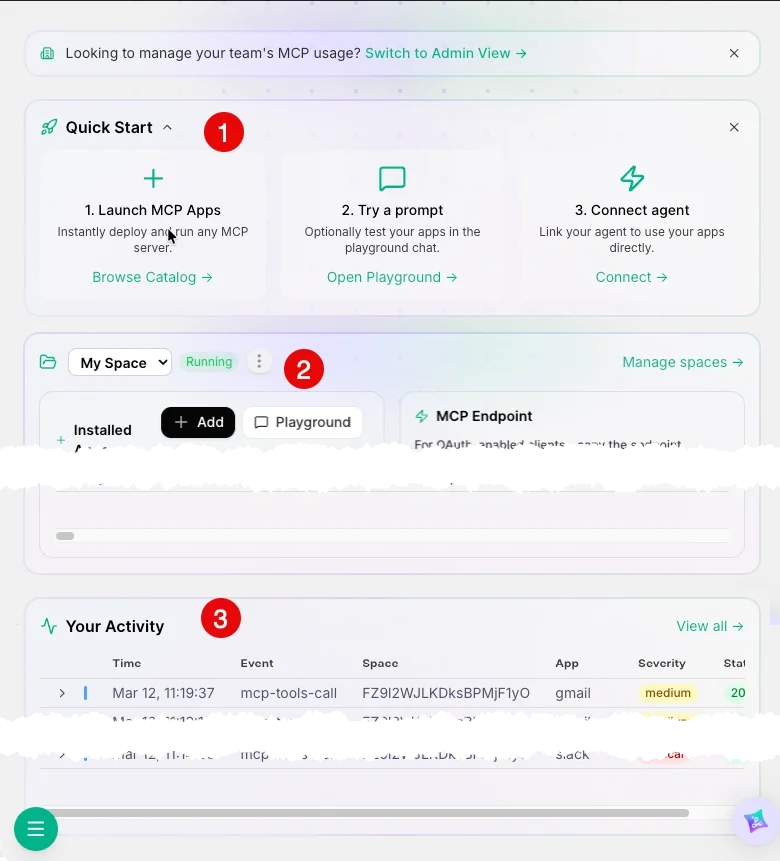
The user dashboard consists of 3 sections:
- Quick Start, which provides shortcuts to key MCPTotal features. This section can be dismissed from the dashboard page when no longer needed.
- Space activity overview.
- Most recent activity log records.
The spaces card
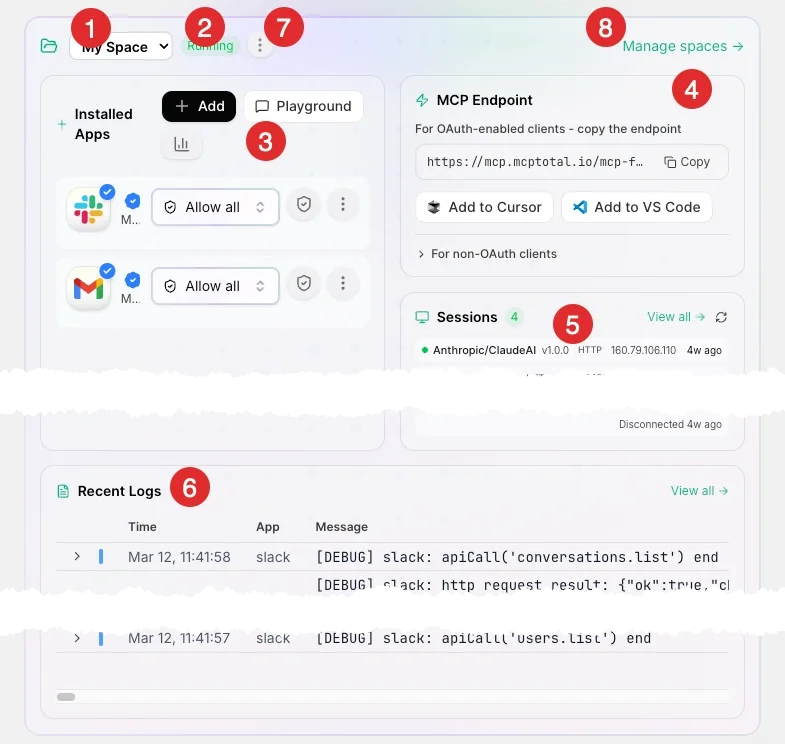
In this section, you can select a space (1) and see:
- The space’s status:
indicating the space is ready to receive and process requests.
indicating MCPTotal has suspended the space due to inactivity.
indicating the space is starting up, having been resumed.
- A list of apps installed in the space, with buttons to add another app, open the playground (MCPTotal chat), and an expandable card to display the resources used by the space (e.g., memory, CPU, and network).
- The space's endpoint details, including buttons to add the endpoint to Cursor or VS Code, and an expandable section that lets you copy the space's API key and shareable link.
- A list of sessions: instances of IDE or AI agent use of the space.
- The most recent logs of activity in the space, showing the time, the activity app, and the message type. You can expand each line to view the activity's event details.
In addition, there is a menu (7) that provides options to view audit logs, access the space dashboard settings, share the space, and delete the space, along with a link (8) to the spaces page.
The Your Activity card
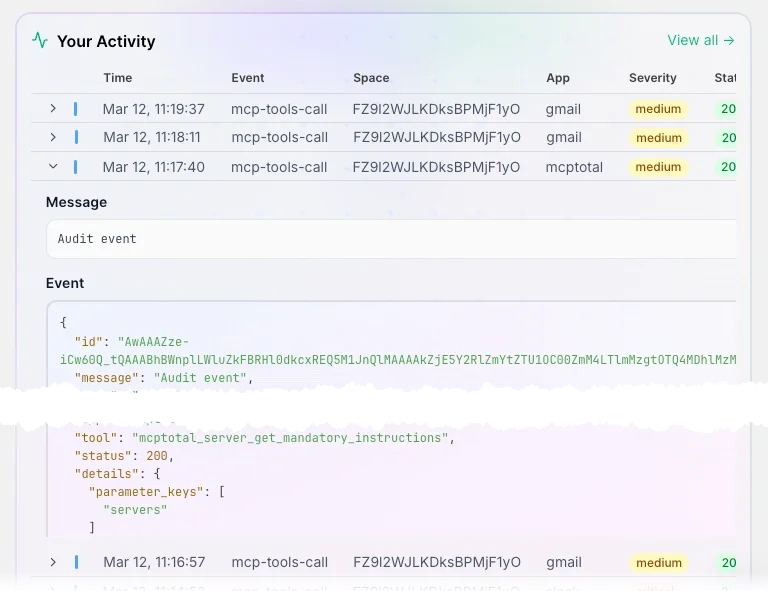
The Your Activity card displays the 5 most recent logs of activity across all your spaces. The information includes: the time of the log, the event, the space in which the event took place, the MCPTotal app involved, the potential security severity of the activity, and the activity's HTTP status. You can expand each row to see the information in detail and view all activity logs by clicking View all.
See Audit log events and Audit log severity for more information on the severity and event items.
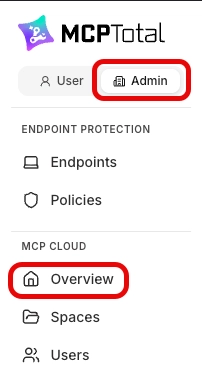
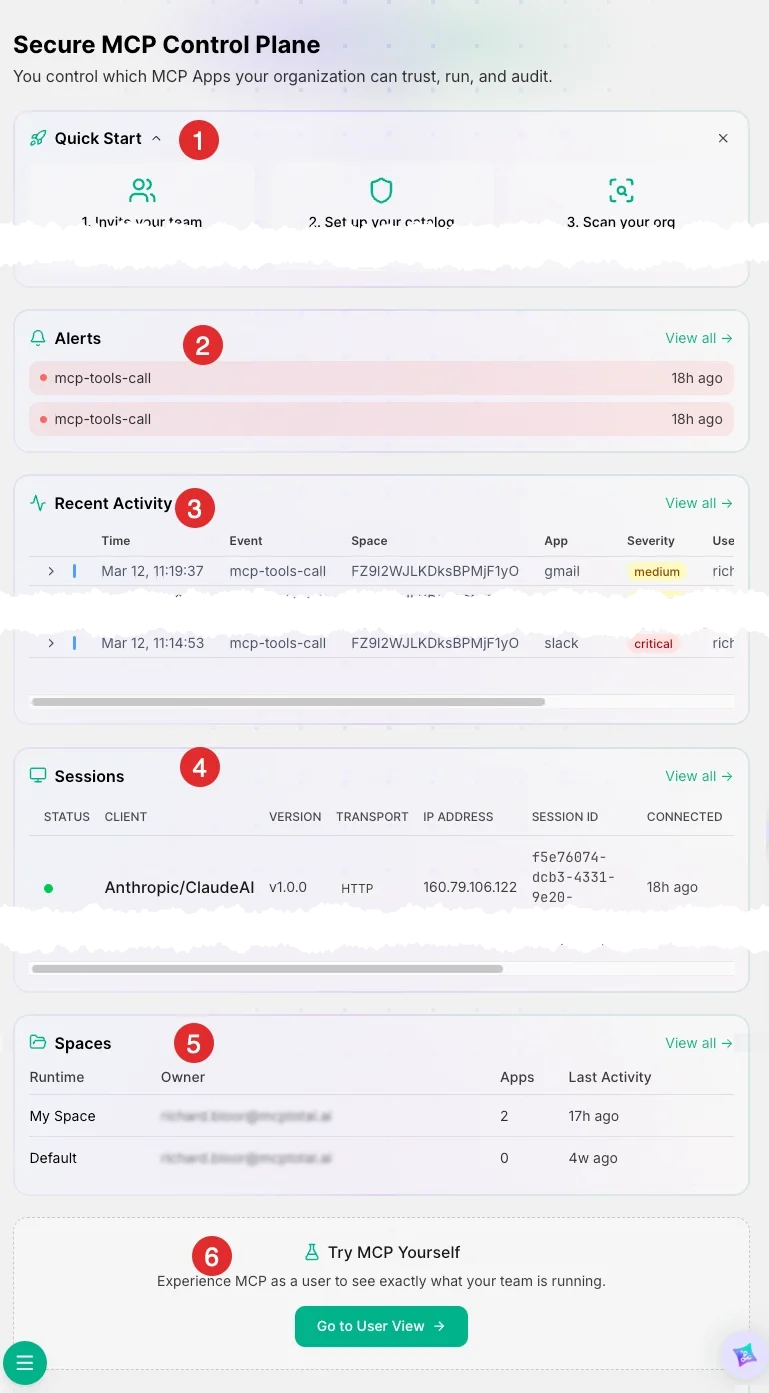
The admin dashboard
You access the admin dashboard by selecting the Admin toggle in the main menu and clicking Overview.
The admin dashboard consists of 6 sections:
- Quick Start, which provides shortcuts to key MCPTotal features. This section can be dismissed from the dashboard page when no longer needed.
- A list of the most recent alerts, with a link to view the full list.
- A list of the most recent activity, with a link to view the full list.
- A list of the most recent sessions, with a link to view the full list.
- A list of recently used spaces, with a link to view the full list.
- An invite to explore MCPTotal as a user.
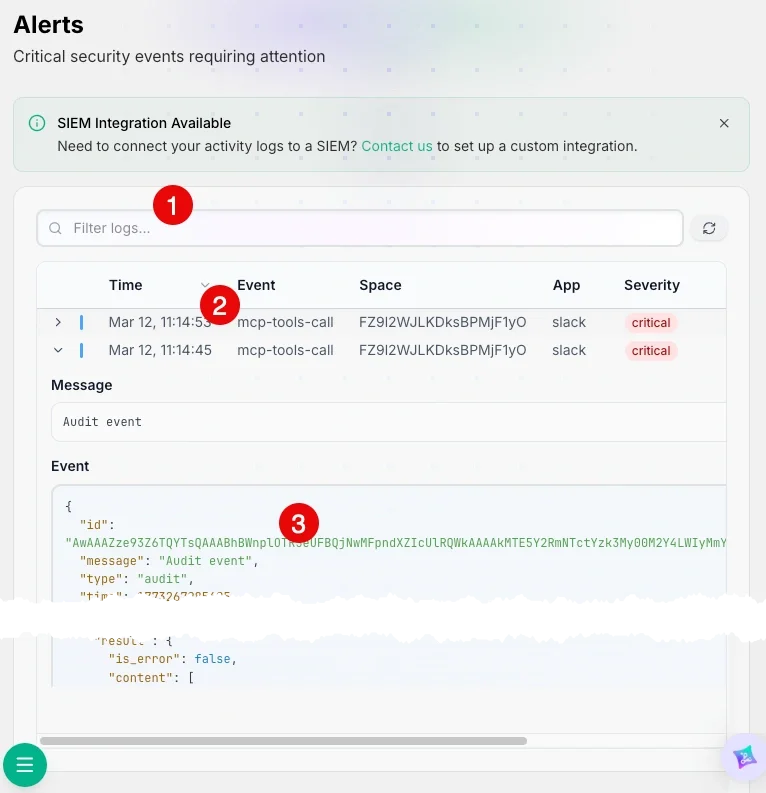
Alerts
Alerts provide details for audit logs of activities identified as potentially critical security events. The detail screen provides:
- Options to search for words or phrases in the alert log records.
- A summary line for an alert, showing the time of the activity, the event that took place, the space, the app that the event took place in, the severity of the event, the user, and the status (standard HTTP response status code).
- An expandable section that shows the full audit log for the alert.
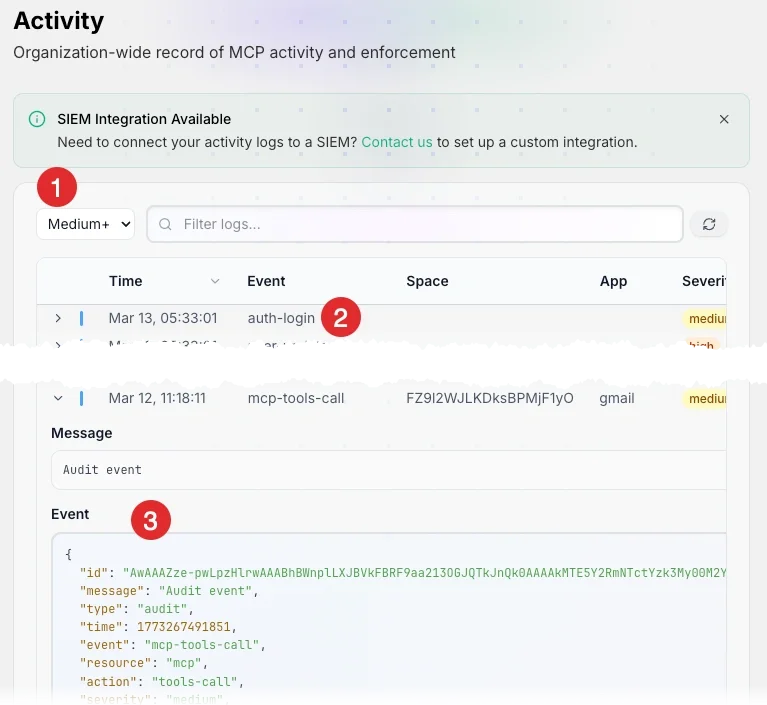
Recent activity (audit log)
The activity log records every activity in a space. The detail screen includes:
- Options to filter activity log by the severity of the log item or the presence of a search word in the log records.
- A summary line for an activity, showing the time of the activity, the event that took place, the space, the app that the event took place in, the severity of the event, the user, and the status (standard HTTP response status code).
- An expandable section that shows the full audit log.
Audit log severity
The severity of an audit log can be:
- Critical — security incidents: policy blocks, guardrail threats, and unauthorized access (all calls via 403 at runtime).
- High — privilege-sensitive: user or role management, auth failures, API key exposure, policy changes, and scans.
- Medium — state-changing operations: app installs, connections, space mutations, MCP tool calls, and AI execution.
- Low — read-only: listings, status checks, views, and MCP enumerations.
Audit log events
These events are recorded in the audit log:
| Event | Severity | Description |
|---|---|---|
| agent-[agent name]-blocked | High | Desktop agent tool blocked by policy |
| agent-events | Low | Desktop agent events received |
| agent-execute | Medium | Desktop agent scan/report received |
| app-delete | Medium | App removed from space |
| app-install | Medium | App installed in space |
| app-restrictions-list | Low | App restrictions listed |
| app-restrictions-update | Medium | App tool restrictions changed |
| app-restrictions-view | Low | App restrictions viewed |
| auth-lockout | High | Account locked after repeated failures |
| auth-login | Medium | Successful login |
| auth-login-failed | High | Failed login attempt |
| auth-login-started | Low | Login flow initiated (pre-auth) |
| auth-password-change | Medium | Password changed |
| catalog-list | Low | App catalog browsed |
| chatbot-execute | Medium | AI chat message executed |
| connection-callback | Medium | OAuth connection callback |
| connection-create | Medium | OAuth connection created |
| connection-delete | Medium | OAuth connection deleted |
| connection-list | Low | Connections listed |
| custom-app-create | Medium | Custom MCP app created |
| custom-app-delete | Medium | Custom MCP app deleted |
| custom-app-update | Medium | Custom MCP app modified |
| dcr-create | Medium | Dynamic client registration |
| guardrails-execute | Medium | Guardrails check executed |
| logs-list | Low | Audit logs listed |
| mcp-completion-complete | Medium | MCP completion request |
| mcp-initialize | Medium | MCP session initialized |
| mcp-logging-setLevel | Medium | MCP log level changed |
| mcp-ping | Low | MCP ping |
| mcp-prompts-get | Medium | MCP prompt retrieved |
| mcp-prompts-list | Low | MCP prompts listed |
| mcp-resources-list | Low | MCP resources listed |
| mcp-resources-read | Medium | MCP resource read |
| mcp-roots-list | Low | MCP roots listed |
| mcp-session-create | Medium | MCP client session started |
| mcp-session-delete | Medium | MCP client session ended |
| mcp-session-invalid | Medium | Invalid MCP session attempt |
| mcp-session-view | Low | MCP session details viewed |
| mcp-tools-call | Medium | MCP tool invoked |
| mcp-tools-list | Low | MCP tools listed |
| network-connect | Medium | A new network connection |
| network-resolve | Low | A DNS lookup completed |
| oauth-auth-request | Medium | OAuth flow initiated |
| oauth-callback | Medium | OAuth callback received |
| oauth-exchange | Medium | OAuth token exchanged |
| operator-key-create | High | Credential created |
| operator-key-delete | High | Credential deleted |
| operator-key-list | Low | A read-only listing of credentials |
| operator-key-update | High | Credential mutated |
| org-tools-info-view | Low | Org tool info viewed |
| policy-update | High | Org-level policy modified |
| policy-view | Low | Policy viewed |
| scan-create | High | VIZ scan report uploaded |
| scan-delete | High | VIZ scan report deleted |
| scan-list | Low | Scans listed |
| scan-update | High | VIZ scan report modified |
| scan-view | High | VIZ scan report viewed |
| security-scan-create | Medium | Security scan initiated |
| security-scan-delete | Medium | Security scan deleted |
| security-scan-status | Low | Security scan status checked |
| security-scan-view | Low | Security scan results viewed |
| siem-scan-execute | High | SIEM scan triggered |
| siem-scan-list | Low | SIEM scan engines listed |
| siem-scan-status | Low | SIEM scan status checked |
| space-api-key-view | High | Sensitive API key viewed |
| space-create | Medium | New space created |
| space-delete | Medium | Space deleted |
| space-features-status | Low | Space feature status checked |
| space-features-update | Medium | Space feature flags toggled |
| space-list | Low | Spaces listed |
| space-metrics | Low | Space metrics viewed |
| space-pause | Medium | Spaced paused due to inactivity |
| space-reload | Low | Space reload triggered |
| space-resume | Medium | Paused space restarted |
| space-sessions | Low | Space sessions viewed |
| space-share | Medium | Space shared with another user |
| space-status | Low | Space status checked |
| space-try-tool | Medium | Tool tested from UI |
| space-unshare | Medium | Space sharing revoked |
| space-update | Medium | Space configuration modified |
| space-view | Low | Space details viewed |
| tenant-create | Medium | New tenant provisioned |
| tool-approve | Medium | Tool execution approved by the user |
| tool-list | Low | Tools listed |
| tool-reject | Medium | Tool execution rejected by user |
| tool-view-approval | Low | Tool approval status viewed |
| user-create | High | New user created in org |
| user-delete | High | User removed from org |
| user-role-change | High | User role/privilege changed |
| user-update | High | User identity/profile modified |
| users-list | Low | Org users listed |
| users-view | Low | User details viewed |