
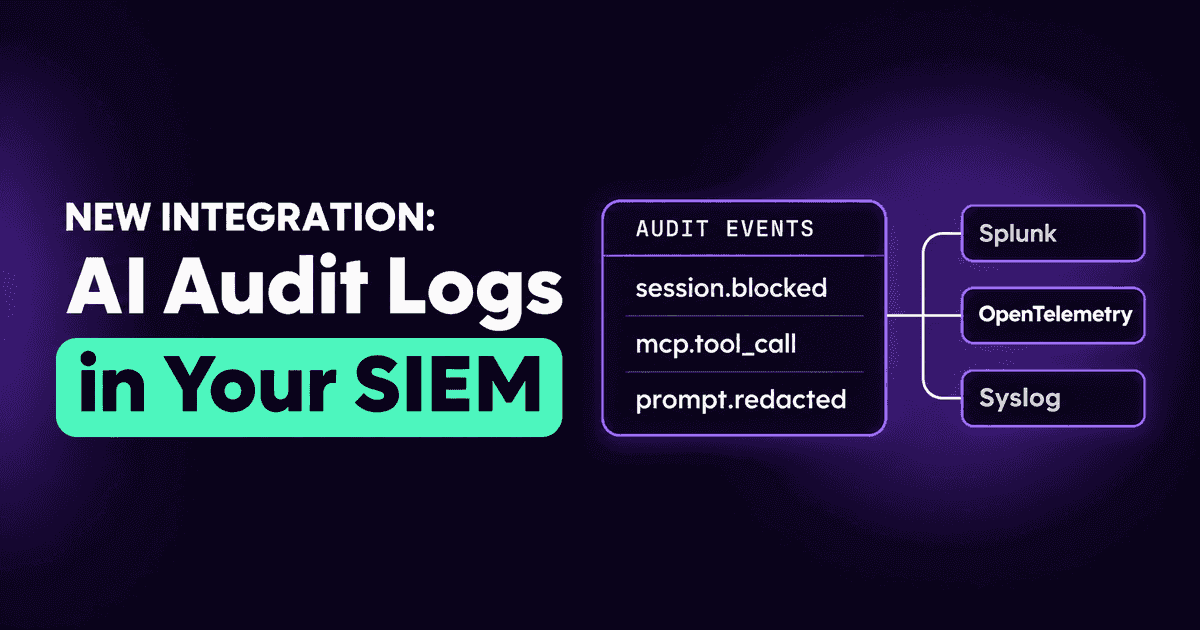
AI Audit Logs in Your SIEM: Splunk, OpenTelemetry, Syslog
Last month we brought AI agent findings and audit logs into IBM QRadar. The question we heard next was simple: "We run Splunk. Or an OpenTelemetry pipeline. Or plain syslog. When do we get it?" Today, AI audit logs reach your SIEM whatever it is: Splunk, any OpenTelemetry collector, a syslog collector, Coralogix, with the same filters your Slack and webhook alerts use.
Why the AI audit trail belongs in your SIEM
An AI agent session is a security event like any other. A coding agent runs a command, a desktop assistant reads a file, an MCP tool call reaches a production system, a policy blocks a prompt. Each of those is recorded in our audit trail, with who did it, on which machine, with which agent, and what the platform decided.
That record is most useful next to everything else your SOC already collects. The agent that touched a secret is interesting; the same agent on a laptop your EDR flagged an hour earlier, used by an account that just failed an MFA check, is a story. Correlation happens in the SIEM, so the AI audit trail has to be there, not in one more console someone remembers to open.
Five SIEM destinations, one setup each
The SIEM section of Integrations now has five destinations for the audit trail:
- Splunk, through its HTTP Event Collector, into the index you already search.
- OpenTelemetry, to any OTLP-compatible endpoint over OTLP/HTTP. If your logging already flows through an OpenTelemetry collector, AI agent activity joins it like any other service's logs, and from there goes wherever your collector sends it.
- Syslog, to your syslog collector over TCP, UDP or TLS, in either standard syslog format.
- Coralogix, grouped the way your Coralogix account already groups logs.
- IBM QRadar, which pulls the audit log, as it has since September.
You can add more than one Splunk, OpenTelemetry, Syslog or Coralogix destination, for example one per region or one for the SOC and one for an MSSP. Each has a Test Connection button, so you know it works before you rely on it. And a destination we push to can now be disabled without being deleted: its settings and credentials are kept, nothing is sent while it is off, and Enable brings it back as it was. That makes a maintenance window on the SIEM side a click, not a re-setup.
If your SIEM isn't in that list, OpenTelemetry and syslog are the two formats almost every log platform accepts, so they are usually the way in.
Slack and webhooks, on the same footing
A SIEM is where events are kept and correlated. Some events also need a person right now, which is why audit alerts already went to Slack and to webhooks: a channel for the people on call, an endpoint for your SOAR or your own automation. They now take the same filters as the SIEM destinations, so one decision about what matters applies everywhere you send it.
Send each destination only what it needs
Not every destination wants everything. The SOC's SIEM wants the whole record; a Slack channel wants only what someone should look at today. Every destination we push to, the SIEMs, Slack and the webhook alike, now has the same two filters (QRadar pulls the log, so it takes it whole):
- Audit Event Filters, by category: All, Alerts, Sessions, Console (what administrators do in the console: sign-ins, policy changes, user and role management), MCP Cloud and Enforcement. Pick several to send any of them.
- Minimum severity, from low to critical.
The SIEM destinations send everything from low severity up by default, because a SIEM is the place for the full record. Slack and the webhook default to high, because a channel nobody reads helps nobody.
Since then
We kept going after this release. Three additions are worth knowing about:
Richer Slack alerts (October 16). A Slack alert now carries more of the event, its key fields and its details, and a link to the matching view of the console's Activity, so whoever is on call starts from the alert, not from a search.
Delivery health, in the product (October 26). A destination that stops accepting events is a gap in your audit trail, and you shouldn't learn about it in an incident review. Each push destination is now checked: when it has accepted nothing for a while and the attempts to reach it are failing, its card turns to Error with the reason in plain words, such as the HTTP status it answered or that it couldn't be reached. It returns to Connected by itself once events flow again.
The audit export speaks the Enforcement tab's language (November 4). The decisions made on your endpoints, whether a block, a redaction, or what monitor mode would have blocked, now carry the same decision stamp in the exported events as on the console's Enforcement tab. A new Decisions category sends them, and IBM QRadar reads them too. Your SIEM and the console now tell the same story in the same words.
What this adds up to
When we brought findings and audit logs into IBM QRadar, the point was that AI agent security should work inside the tools your SOC already uses. This release takes that to the SIEMs most teams run. Your analysts don't learn a new console; they get a new source, filtered to what each destination needs, next to the endpoint, identity and network data they already correlate.
Our integrations page lists every destination, and pricing has the plans.
Try it
Want to see your AI agents' audit trail in your own SIEM? Start a free trial: we'll walk you through the platform and set it up with you.
Related posts
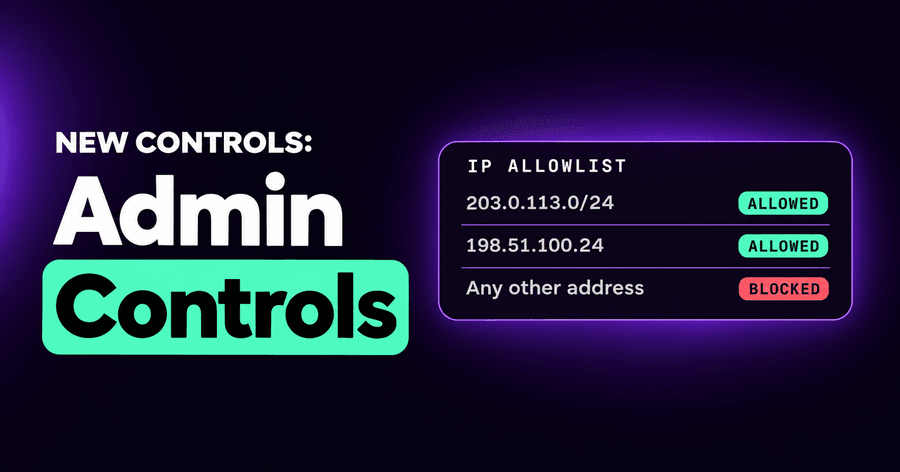
AI Security Admin Controls: IP Allowlist, OWASP and MITRE
A console IP allowlist, one Enforcement tab that names the deciding rule, OWASP and MITRE tags on findings, AI spend priced per vendor, and session export.
Read More
AI Security in Your SOC: API, Webhook and IBM QRadar
Scoped API keys, a findings API and webhook in beta, and an IBM QRadar integration bring AI agent findings and audit logs into the tools your SOC already uses.
Read More
Agentless Security for ChatGPT Enterprise, Claude, Copilot
Connect Claude Enterprise, ChatGPT Enterprise (with Codex) and Microsoft 365 Copilot and see every chat and agent session in one place, with nothing to install.
Read More